Cheese: Difference between revisions
| Line 66: | Line 66: | ||
== Production == | == Production == | ||
{{Infobox agricultural production|plant=cheese|country6={{NLD}}|world=23.3|country10={{RUS}}|amount10=0.48|country9={{EGY}}|amount9=0.53|country8={{CAN}}|amount8=0.60|country7={{POL}}|amount7=0.77|amount6=0.95|amount1=9.83|country5={{ITA}}|amount5=1.30|country4={{FRA}}|amount4=1.61|country3={{GER}}|amount3=2.56|country2={{USA}}|amount2=6.16|country1={{EU}} (UK not included)|year=2019}}In 2014, world production of cheese from whole cow milk was 18.7 million [[tonne]]s, with the United States accounting for 29% (5.4 million tonnes) of the world total followed by Germany, France and Italy as major producers (table). | {{Infobox agricultural production|plant=cheese|country6={{NLD}}|world=23.3|country10={{RUS}}|amount10=0.48|country9={{EGY}}|amount9=0.53|country8={{CAN}}|amount8=0.60|country7={{POL}}|amount7=0.77|amount6=0.95|amount1=9.83|country5={{ITA}}|amount5=1.30|country4={{FRA}}|amount4=1.61|country3={{GER}}|amount3=2.56|country2={{USA}}|amount2=6.16|country1={{EU}} (UK not included)|year=2019}}In 2014, world production of cheese from whole cow milk was 18.7 million [[Wikipedia:tonne|tonne]]s, with the United States accounting for 29% (5.4 million tonnes) of the world total followed by Germany, France and Italy as major producers (table). | ||
Other 2014 world totals for processed cheese include: | Other 2014 world totals for processed cheese include: | ||
* from skimmed cow milk, 2.4 million tonnes (leading country, Germany, 845,500 tonnes) | * from skimmed cow milk, 2.4 million tonnes (leading country, Germany, 845,500 tonnes) | ||
* from goat milk, 523,040 tonnes (leading country, [[South Sudan]], 110,750 tonnes) | * from goat milk, 523,040 tonnes (leading country, [[Wikipedia:South Sudan|South Sudan]], 110,750 tonnes) | ||
* from sheep milk, 680,302 tonnes (leading country, [[Greece]], 125,000 tonnes) | * from sheep milk, 680,302 tonnes (leading country, [[Wikipedia:Greece|Greece]], 125,000 tonnes) | ||
* from [[water buffalo|buffalo]] milk, 282,127 tonnes (leading country, [[Egypt]], 254,000 tonnes) | * from [[:en:water buffalo|buffalo]] milk, 282,127 tonnes (leading country, [[Wikipedia:Egypt|Egypt]], 254,000 tonnes) | ||
During 2015, Germany, France, Netherlands and Italy exported 10–14% of their produced cheese. | During 2015, Germany, France, Netherlands and Italy exported 10–14% of their produced cheese. The United States was a marginal exporter (5.3% of total cow milk production), as most of its output was for the domestic market. | ||
The [[carbon footprint]] of a kilogram of cheese ranges from 6 to 12 kg of [[CO2eq|CO<sub>2</sub>eq]], depending on the amount of milk used; thus it is generally lower than beef or lamb but higher than other foods. | The [[Wikipedia:carbon footprint|carbon footprint]] of a kilogram of cheese ranges from 6 to 12 kg of [[:en:CO2eq|CO<sub>2</sub>eq]], depending on the amount of milk used; thus it is generally lower than beef or lamb but higher than other foods. | ||
=== Consumption === | === Consumption === | ||
France, Iceland, Finland, Denmark and Germany were the highest consumers of cheese in 2014, averaging {{convert|25|kg|abbr=on}} per person per annum. | France, Iceland, Finland, Denmark and Germany were the highest consumers of cheese in 2014, averaging {{convert|25|kg|abbr=on}} per person per annum. | ||
== Processing == | == Processing == | ||
Revision as of 16:42, 11 June 2023


Cheese is a dairy product produced in wide ranges of flavors, , and forms by coagulation of the milk protein casein. It comprises proteins and fat from milk (usually the milk of cows, buffalo, goats, or sheep). During production, milk is usually acidified and either the enzymes of rennet or bacterial enzymes with similar activity are added to cause the casein to coagulate. The solid curds are then separated from the liquid whey and pressed into finished cheese. Some cheeses have aromatic molds on the rind, the outer layer, or throughout.
Over a thousand types of cheese exist and are produced in various countries. Their styles, textures and flavors depend on the origin of the milk (including the animal's diet), whether they have been pasteurized, the butterfat content, the bacteria and mold, the processing, and how long they have been aged. Herbs, spices, or wood smoke may be used as en:flavoring agents. The yellow to red color of many cheeses is produced by adding annatto. Other ingredients may be added to some cheeses, such as black pepper, garlic, chives, or cranberries. A cheesemonger, or specialist seller of cheeses, may have expertise with selecting, purchasing, receiving, storing and ripening cheeses.
For a few cheeses, the milk is curdled by adding acids such as vinegar or lemon juice. Most cheeses are acidified to a lesser degree by bacteria, which turn milk sugars into lactic acid, then the addition of rennet completes the curdling. Vegetarian alternatives to rennet are available; most are produced by fermentation of the fungus Mucor miehei, but others have been extracted from various species of the Cynara thistle family. Cheesemakers near a dairy region may benefit from fresher, lower-priced milk, and lower shipping costs.
Cheese is valued for its portability, long shelf life, and high content of fat, protein, calcium, and phosphorus. Cheese is more compact and has a longer shelf life than milk, although how long a cheese will keep depends on the type of cheese. Hard cheeses, such as Parmesan, last longer than soft cheeses, such as Brie or goat's milk cheese. The long storage life of some cheeses, especially when encased in a protective rind, allows selling when markets are favorable. Vacuum packaging of block-shaped cheeses and gas-flushing of plastic bags with mixtures of carbon dioxide and nitrogen are used for storage and mass distribution of cheeses in the 21st century.
Etymology

The word cheese comes from Latin caseus, from which the modern word casein is also derived. The earliest source is from the proto-Indo-European root *kwat-, which means "to ferment, become sour". That gave rise to cīese or cēse (in Old English) and chese (in Middle English). Similar words are shared by other West Germanic languages—West Frisian tsiis, Dutch kaas, German Käse, Old High German chāsi—all from the reconstructed West-Germanic form *kāsī, which in turn is an early borrowing from Latin.
The Online Etymological Dictionary states that "cheese" comes from:
Old English cyse (West Saxon), cese (Anglian) ... from West Germanic *kasjus (source also of Old Saxon kasi, Old High German chasi, German Käse, Middle Dutch case, Dutch kaas), from Latin caseus [for] "cheese" (source of Italian cacio, Spanish queso, Irish caise, Welsh caws).
The Online Etymological Dictionary states that the word is of:
unknown origin; perhaps from a PIE root *kwat- "to ferment, become sour" (source also of Prakrit chasi "buttermilk;" Old Church Slavonic kvasu "leaven; fermented drink," kyselu "sour," -kyseti "to turn sour;" Czech kysati "to turn sour, rot;" Sanskrit kvathati "boils, seethes;" Gothic hwaþjan "foam"). Also compare fromage. Old Norse ostr, Danish ost, Swedish ost are related to Latin ius "broth, sauce, juice."
When the Romans began to make hard cheeses for their legionaries' supplies, a new word started to be used: formaticum, from caseus formatus, or "molded cheese" (as in "formed", not "moldy"). It is from this word that the French fromage, standard Italian formaggio, Catalan formatge, Breton fourmaj, and Occitan fromatge (or formatge) are derived. Of the Romance languages, Spanish, Portuguese, Romanian, Tuscan and Southern Italian dialects use words derived from caseus (queso, queijo, caș and caso for example). The word cheese itself is occasionally employed in a sense that means "molded" or "formed". Head cheese uses the word in this sense. The term "cheese" is also used as a noun, verb and adjective in a number of figurative expressions (e.g., "the big cheese", "to be cheesed off" and "cheesy lyrics").
History
Origins

Cheese is an ancient food whose origins predate recorded history. There is no conclusive evidence indicating where cheesemaking originated, whether in Europe, Central Asia or the Middle East. Earliest proposed dates for the origin of cheesemaking range from around 8000 BCE, when sheep were first domesticated. Since animal skins and inflated internal organs have, since ancient times, provided storage vessels for a range of foodstuffs, it is probable that the process of cheese making was discovered accidentally by storing milk in a container made from the stomach of an animal, resulting in the milk being turned to curd and whey by the rennet from the stomach. There is a legend—with variations—about the discovery of cheese by an Arab trader who used this method of storing milk.
The earliest evidence of cheesemaking in the archaeological record dates back to 5500 BCE and is found in what is now Kuyavia, Poland, where strainers coated with milk-fat molecules have been found.
Cheesemaking may have begun independently of this by the pressing and salting of curdled milk to preserve it. Observation that the effect of making cheese in an animal stomach gave more solid and better-textured curds may have led to the deliberate addition of rennet. Early archeological evidence of Egyptian cheese has been found in Egyptian tomb murals, dating to about 2000 BCE. A 2018 scientific paper stated that the world's oldest cheese, dating to approximately 1200 BCE (3200 years before present), was found in ancient Egyptian tombs.
The earliest cheeses were likely quite sour and salty, similar in texture to rustic cottage cheese or feta, a crumbly, flavorful Greek cheese. Cheese produced in Europe, where climates are cooler than the Middle East, required less salt for preservation. With less salt and acidity, the cheese became a suitable environment for useful microbes and molds, giving aged cheeses their respective flavors. The earliest ever discovered preserved cheese was found in the Taklamakan Desert in Xinjiang, China, dating back as early as 1615 BCE (3600 years before present).
Ancient Greece and Rome

Ancient Greek mythology credited Aristaeus with the discovery of cheese. Homer's Odyssey (8th century BCE) describes the Cyclops making and storing sheep's and goats' milk cheese (translation by Samuel Butler):
We soon reached his cave, but he was out shepherding, so we went inside and took stock of all that we could see. His cheese-racks were loaded with cheeses, and he had more lambs and kids than his pens could hold...
When he had so done he sat down and milked his ewes and goats, all in due course, and then let each of them have her own young. He curdled half the milk and set it aside in wicker strainers.
Columella's De Re Rustica (c. 65 CE) details a cheesemaking process involving rennet coagulation, pressing of the curd, salting, and aging. According to Pliny the Elder, it had become a sophisticated enterprise by the time the Roman Empire came into being. Pliny the Elder also mentions in his writings Caseus Helveticus, a hard Sbrinz-like cheese produced by the Helvetii. Pliny's Natural History (77 CE) devotes a chapter (XI, 97) to describing the diversity of cheeses enjoyed by Romans of the early Empire. He stated that the best cheeses came from the villages near Nîmes, but did not keep long and had to be eaten fresh. Cheeses of the Alps and Apennines were as remarkable for their variety then as now. A Ligurian cheese was noted for being made mostly from sheep's milk, and some cheeses produced nearby were stated to weigh as much as a thousand pounds each. Goats' milk cheese was a recent taste in Rome, improved over the "medicinal taste" of Gaul's similar cheeses by smoking. Of cheeses from overseas, Pliny preferred those of Bithynia in Asia Minor.
Post-Roman Europe

As Romanized populations encountered unfamiliar newly settled neighbors, bringing their own cheese-making traditions, their own flocks and their own unrelated words for cheese, cheeses in Europe diversified further, with various locales developing their own distinctive traditions and products. As long-distance trade collapsed, only travelers would encounter unfamiliar cheeses: Charlemagne's first encounter with a white cheese that had an edible rind forms one of the constructed anecdotes of Notker's Life of the Emperor.
The British Cheese Board claims that Britain has approximately 700 distinct local cheeses; France and Italy have perhaps 400 each (a French proverb holds there is a different French cheese for every day of the year, and Charles de Gaulle once asked "how can you govern a country in which there are 246 kinds of cheese?"). Still, the advancement of the cheese art in Europe was slow during the centuries after Rome's fall. Many cheeses popular today were first recorded in the late Middle Ages or after—cheeses like Cheddar around 1500, Parmesan in 1597, Gouda in 1697, and Camembert in 1791.
In 1546, The Proverbs of John Heywood claimed "the moon is made of a green cheese" (Greene may refer here not to the color, as many now think, but to being new or unaged). Variations on this sentiment were long repeated and NASA exploited this myth for an April Fools' Day spoof announcement in 2006.
Modern era

Until its modern spread along with European culture, cheese was nearly unheard of in east Asian cultures and in the pre-Columbian Americas and had only limited use in sub-Mediterranean Africa, mainly being widespread and popular only in Europe, the Middle East, the Indian subcontinent, and areas influenced by those cultures. But with the spread, first of European imperialism, and later of Euro-American culture and food, cheese has gradually become known and increasingly popular worldwide.
The first factory for the industrial production of cheese opened in Switzerland in 1815, but large-scale production first found real success in the United States. Credit usually goes to Jesse Williams, a dairy farmer from Rome, New York, who in 1851 started making cheese in an assembly-line fashion using the milk from neighboring farms; this made cheddar cheese one of the first US industrial foods. Within decades, hundreds of such commercial dairy associations existed.
The 1860s saw the beginnings of mass-produced rennet, and by the turn of the century scientists were producing pure microbial cultures. Before then, bacteria in cheesemaking had come from the environment or from recycling an earlier batch's whey; the pure cultures meant a more standardized cheese could be produced.
Factory-made cheese overtook traditional cheesemaking in the World War II era, and factories have been the source of most cheese in America and Europe ever since. By 2012, cheese was one of the most shoplifted items from supermarkets worldwide.
Production
| Top cheese producers | |
|---|---|
| in 2019 | |
| Numbers in million tonnes | |
| 1. | 9.83 |
| 2. | 6.16 |
| 3. | 2.56 |
| 4. | 1.61 |
| 5. | 1.30 |
| 6. | 0.95 |
| 7. | 0.77 |
| 8. | 0.60 |
| 9. | 0.53 |
| 10. | 0.48 |
| World total | 23.3 |
| Source: UN Food and Agriculture Organization | |
In 2014, world production of cheese from whole cow milk was 18.7 million tonnes, with the United States accounting for 29% (5.4 million tonnes) of the world total followed by Germany, France and Italy as major producers (table).
Other 2014 world totals for processed cheese include:
- from skimmed cow milk, 2.4 million tonnes (leading country, Germany, 845,500 tonnes)
- from goat milk, 523,040 tonnes (leading country, South Sudan, 110,750 tonnes)
- from sheep milk, 680,302 tonnes (leading country, Greece, 125,000 tonnes)
- from buffalo milk, 282,127 tonnes (leading country, Egypt, 254,000 tonnes)
During 2015, Germany, France, Netherlands and Italy exported 10–14% of their produced cheese. The United States was a marginal exporter (5.3% of total cow milk production), as most of its output was for the domestic market.
The carbon footprint of a kilogram of cheese ranges from 6 to 12 kg of CO2eq, depending on the amount of milk used; thus it is generally lower than beef or lamb but higher than other foods.
Consumption
France, Iceland, Finland, Denmark and Germany were the highest consumers of cheese in 2014, averaging 25 kg (55 lb) per person per annum.
Processing
Template:More citations needed
Curdling

A required step in cheesemaking is separating the milk into solid curds and liquid whey. Usually this is done by acidifying (souring) the milk and adding rennet. The acidification can be accomplished directly by the addition of an acid, such as vinegar, in a few cases (paneer, queso fresco). More commonly starter bacteria are employed instead which convert milk sugars into lactic acid. The same bacteria (and the enzymes they produce) also play a large role in the eventual flavor of aged cheeses. Most cheeses are made with starter bacteria from the Lactococcus, Lactobacillus, or Streptococcus genera. Swiss starter cultures also include Propionibacter shermani, which produces propionic acid and carbon dioxide gas bubbles during aging, giving Swiss cheese or Emmental its holes (called "eyes").
Some fresh cheeses are curdled only by acidity, but most cheeses also use rennet. Rennet sets the cheese into a strong and rubbery gel compared to the fragile curds produced by acidic coagulation alone. It also allows curdling at a lower acidity—important because flavor-making bacteria are inhibited in high-acidity environments. In general, softer, smaller, fresher cheeses are curdled with a greater proportion of acid to rennet than harder, larger, longer-aged varieties.
While rennet was traditionally produced via extraction from the inner mucosa of the fourth stomach chamber of slaughtered young, unweaned calves, most rennet used today in cheesemaking is produced recombinantly.[1] The majority of the applied chymosin is retained in the whey and, at most, may be present in cheese in trace quantities. In ripe cheese, the type and provenance of chymosin used in production cannot be determined.[1]
Curd processing
At this point, the cheese has set into a very moist gel. Some soft cheeses are now essentially complete: they are drained, salted, and packaged. For most of the rest, the curd is cut into small cubes. This allows water to drain from the individual pieces of curd.
Some hard cheeses are then heated to temperatures in the range of 35–55 °C (95–131 °F). This forces more whey from the cut curd. It also changes the taste of the finished cheese, affecting both the bacterial culture and the milk chemistry. Cheeses that are heated to the higher temperatures are usually made with thermophilic starter bacteria that survive this step—either Lactobacilli or Streptococci.
Salt has roles in cheese besides adding a salty flavor. It preserves cheese from spoiling, draws moisture from the curd, and firms cheese's texture in an interaction with its proteins. Some cheeses are salted from the outside with dry salt or brine washes. Most cheeses have the salt mixed directly into the curds.

Other techniques influence a cheese's texture and flavor. Some examples are:
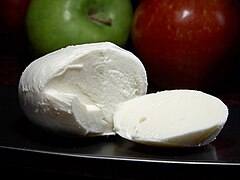
- Stretching: (Mozzarella, Provolone) the curd is stretched and kneaded in hot water, developing a stringy, fibrous body.
- Cheddaring: (Cheddar, other English cheeses) the cut curd is repeatedly piled up, pushing more moisture away. The curd is also mixed (or milled) for a long time, taking the sharp edges off the cut curd pieces and influencing the final product's texture.
- Washing: (Edam, Gouda, Colby) the curd is washed in warm water, lowering its acidity and making for a milder-tasting cheese.
Most cheeses achieve their final shape when the curds are pressed into a mold or form. The harder the cheese, the more pressure is applied. The pressure drives out moisture—the molds are designed to allow water to escape—and unifies the curds into a single solid body.
Ripening

A newborn cheese is usually salty yet bland in flavor and, for harder varieties, rubbery in texture. These qualities are sometimes enjoyed—cheese curds are eaten on their own—but normally cheeses are left to rest under controlled conditions. This aging period (also called ripening, or, from the French, affinage) lasts from a few days to several years. As a cheese ages, microbes and enzymes transform texture and intensify flavor. This transformation is largely a result of the breakdown of casein proteins and milkfat into a complex mix of amino acids, amines, and fatty acids.
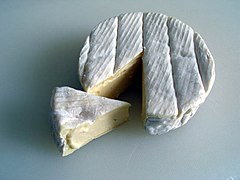
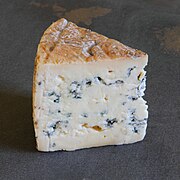
Some cheeses have additional bacteria or molds intentionally introduced before or during aging. In traditional cheesemaking, these microbes might be already present in the aging room; they are allowed to settle and grow on the stored cheeses. More often today, prepared cultures are used, giving more consistent results and putting fewer constraints on the environment where the cheese ages. These cheeses include soft ripened cheeses such as Brie and Camembert, blue cheeses such as Roquefort, Stilton, Gorgonzola, and rind-washed cheeses such as Limburger.
Types
There are many types of cheese, with around 500 different varieties recognized by the International Dairy Federation,[2] more than 400 identified by Walter and Hargrove, more than 500 by Burkhalter, and more than 1,000 by Sandine and Elliker.[3] The varieties may be grouped or classified into types according to criteria such as length of ageing, texture, methods of making, fat content, animal milk, country or region of origin, etc.—with these criteria either being used singly or in combination,[4] but with no single method being universally used.[5] The method most commonly and traditionally used is based on moisture content, which is then further discriminated by fat content and curing or ripening methods.[2][6] Some attempts have been made to rationalise the classification of cheese—a scheme was proposed by Pieter Walstra which uses the primary and secondary starter combined with moisture content, and Walter and Hargrove suggested classifying by production methods which produces 18 types, which are then further grouped by moisture content.[2]
-
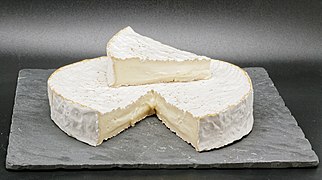 Brie cheese
 -

-
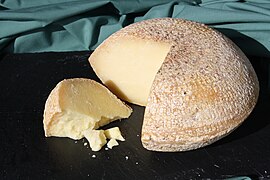
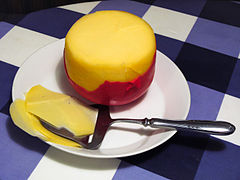
 Maccagno cheese
 -
-

-
-

-

-
 Bergader Almkase cheese
 -
 Sheep milk cheese from Poland
 -
-
 Devil's Gulch cheese
 -
-
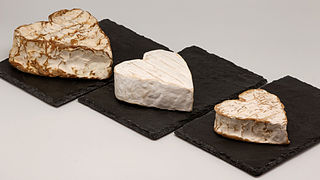
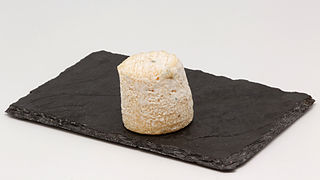
 Saint-Julien aux noix
 -
 Bavaria blu cheese
 -
-

-
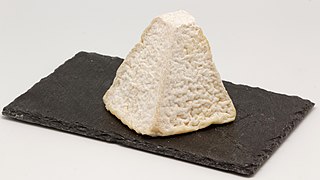
 Tentation du Vercors
 -
-
 Météorite fromage
 -

-

-

-
-
 Österkron blue cheese
 -

-
-
-
-

-

-
-
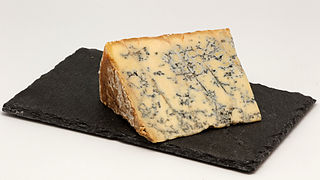
 Isle of Mull Cheese
 -
 Zacharie cheese
 -
 Diverse Sauermilchkäse sour cheese
 -
-
-
 Brie de Nangis
 -
 Rouelle du Tarn
 -


.jpg)

.jpg)


.jpg)


_02.jpg)


_01.jpg)


.jpg)


Cooking and eating

At refrigerator temperatures, the fat in a piece of cheese is as hard as unsoftened butter, and its protein structure is stiff as well. Flavor and odor compounds are less easily liberated when cold. For improvements in flavor and texture, it is widely advised that cheeses be allowed to warm up to room temperature before eating. If the cheese is further warmed, to 26–32 °C (79–90 °F), the fats will begin to "sweat out" as they go beyond soft to fully liquid.[7]
Above room temperatures, most hard cheeses melt. Rennet-curdled cheeses have a gel-like protein matrix that is broken down by heat. When enough protein bonds are broken, the cheese itself turns from a solid to a viscous liquid. Soft, high-moisture cheeses will melt at around 55 °C (131 °F), while hard, low-moisture cheeses such as Parmesan remain solid until they reach about 82 °C (180 °F).[7] Acid-set cheeses, including halloumi, paneer, some whey cheeses and many varieties of fresh goat cheese, have a protein structure that remains intact at high temperatures. When cooked, these cheeses just get firmer as water evaporates.
Some cheeses, like raclette, melt smoothly; many tend to become stringy or suffer from a separation of their fats. Many of these can be coaxed into melting smoothly in the presence of acids or starch. Fondue, with wine providing the acidity, is a good example of a smoothly melted cheese dish.[7] Elastic stringiness is a quality that is sometimes enjoyed, in dishes including pizza and Welsh rarebit. Even a melted cheese eventually turns solid again, after enough moisture is cooked off. The saying "you can't melt cheese twice" (meaning "some things can only be done once") refers to the fact that oils leach out during the first melting and are gone, leaving the non-meltable solids behind.
As its temperature continues to rise, cheese will brown and eventually burn. Browned, partially burned cheese has a particular distinct flavor of its own and is frequently used in cooking (e.g., sprinkling atop items before baking them).
Cheeseboard

A cheeseboard (or cheese course) may be served at the end of a meal before or following dessert, or replacing the last course. The British tradition is to have cheese after dessert, accompanied by sweet wines like Port. In France, cheese is consumed before dessert, with robust red wine.[8][9] A cheeseboard typically has contrasting cheeses with accompaniments, such as crackers, biscuits, grapes, nuts, celery or chutney.[9] A typical cheeseboard may contain four to six cheeses, for example: Mature Cheddar or Comté (hard: cow's milk cheeses); Brie or Camembert (soft: cow's milk); a blue cheese such as Stilton (hard: cow's milk), Roquefort (medium: ewe's milk) or Bleu d'Auvergne (medium-soft cow's milk); a soft/medium-soft goat's cheese (e.g. Sainte-Maure de Touraine, Pantysgawn, Crottin de Chavignol).[9] A cheeseboard 70 feet (21 m) long was used to feature the variety of cheeses manufactured in Wisconsin,[10] where the state legislature recognizes a "cheesehead" hat as a state symbol.[11]
Nutrition and health
The nutritional value of cheese varies widely. Cottage cheese may consist of 4% fat and 11% protein while some whey cheeses are 15% fat and 11% protein, and triple-crème cheeses are 36% fat and 7% protein.[12] In general, cheese is a rich source (20% or more of the Daily Value, DV) of calcium, protein, phosphorus, sodium and saturated fat. A 28-gram (one ounce) serving of cheddar cheese contains about 7 grams (0.25 oz) of protein and 202 milligrams of calcium.[12] Nutritionally, cheese is essentially concentrated milk, but altered by the culturing and aging processes: it takes about 200 grams (7.1 oz) of milk to provide that much protein, and 150 grams (5.3 oz) to equal the calcium, though values for water-soluble vitamins and minerals can vary widely.[12]
| Water | Protein | Fat | Carbs | |
|---|---|---|---|---|
| Swiss | 37.1 | 26.9 | 27.8 | 5.4 |
| Feta | 55.2 | 14.2 | 21.3 | 4.1 |
| Cheddar | 36.8 | 24.9 | 33.1 | 1.3 |
| Mozzarella | 50 | 22.2 | 22.4 | 2.2 |
| Cottage | 80 | 11.1 | 4.3 | 3.4 |
| A | B1 | B2 | B3 | B5 | B6 | B9 | B12 | C | D | E | K | |
|---|---|---|---|---|---|---|---|---|---|---|---|---|
| Swiss | 17 | 4 | 17 | 0 | 4 | 4 | 1 | 56 | 0 | 11 | 2 | 3 |
| Feta | 8 | 10 | 50 | 5 | 10 | 21 | 8 | 28 | 0 | 0 | 1 | 2 |
| Cheddar | 20 | 2 | 22 | 0 | 4 | 4 | 5 | 14 | 0 | 3 | 1 | 3 |
| Mozzarella | 14 | 2 | 17 | 1 | 1 | 2 | 2 | 38 | 0 | 0 | 1 | 3 |
| Cottage | 3 | 2 | 10 | 0 | 6 | 2 | 3 | 7 | 0 | 0 | 0 | 0 |
| Cl | Ca | Fe | Mg | P | K | Na | Zn | Cu | Mn | Se | |
|---|---|---|---|---|---|---|---|---|---|---|---|
| Swiss | 2.8 | 79 | 10 | 1 | 57 | 2 | 8 | 29 | 2 | 0 | 26 |
| Feta | 2.2 | 49 | 4 | 5 | 34 | 2 | 46 | 19 | 2 | 1 | 21 |
| Cheddar | 3 | 72 | 4 | 7 | 51 | 3 | 26 | 21 | 2 | 1 | 20 |
| Mozzarella | 2.8 | 51 | 2 | 5 | 35 | 2 | 26 | 19 | 1 | 1 | 24 |
| Cottage | 3.3 | 8 | 0 | 2 | 16 | 3 | 15 | 3 | 1 | 0 | 14 |
Nutrient data from SELF.com. Abbreviations: Cl = Choline; Ca = Calcium; Fe = Iron; Mg = Magnesium; P = Phosphorus; K = Potassium; Na = Sodium; Zn = Zinc; Cu = Copper; Mn = Manganese; Se = Selenium.
Cardiovascular disease
National health organizations, such as the American Heart Association, Association of UK Dietitians, British National Health Service, and Mayo Clinic, among others, recommend that cheese consumption be minimized, replaced in snacks and meals by plant foods, or restricted to low-fat cheeses to reduce caloric intake and blood levels of LDL fat, which is a risk factor for cardiovascular diseases.[13][14][15][16] There is no high-quality clinical evidence that cheese consumption lowers the risk of cardiovascular diseases.[13]
Pasteurization
A number of food safety agencies around the world have warned of the risks of raw-milk cheeses. The U.S. Food and Drug Administration states that soft raw-milk cheeses can cause "serious infectious diseases including listeriosis, brucellosis, salmonellosis and tuberculosis".[17] It is U.S. law since 1944 that all raw-milk cheeses (including imports since 1951) must be aged at least 60 days. Australia has a wide ban on raw-milk cheeses as well, though in recent years exceptions have been made for Swiss Gruyère, Emmental and Sbrinz, and for French Roquefort.[18] There is a trend for cheeses to be pasteurized even when not required by law.
Pregnant women may face an additional risk from cheese; the U.S. Centers for Disease Control has warned pregnant women against eating soft-ripened cheeses and blue-veined cheeses, due to the listeria risk, which can cause miscarriage or harm the fetus.[19]
Cultural attitudes


Although cheese is a vital source of nutrition in many regions of the world and it is extensively consumed in others, its use is not universal.
Cheese is rarely found in Southeast and East Asian cuisines, presumably for historical reasons as dairy farming has historically been rare in these regions, due in part to low rates of lactase persistence. Paneer (pronounced [pəniːr]) is a fresh cheese common in North India and Pakistan. It is an unaged, non-melting soft cheese made by curdling milk with a fruit- or vegetable-derived acid, such as lemon juice. Its acid-set form (cheese curd), before pressing, is called chhena. In Nepal, the Dairy Development Corporation commercially manufactures cheese made from yak milk and a hard cheese made from either cow or yak milk known as chhurpi.[20] Bhutan also produces a similar cheese called Datshi which is a staple in most Bhutanese curries.[21] The national dish of Bhutan, ema datshi, is made from homemade yak or mare milk cheese and hot peppers.[22] In Yunnan, China, several ethnic minority groups produce Rushan and Rubing from cow's milk.[23] Cheese consumption may be increasing in China, with annual sales doubling from 1996 to 2003 (to a still small 30 million U.S. dollars a year).[24] Certain kinds of Chinese preserved bean curd are sometimes misleadingly referred to in English as "Chinese cheese" because of their texture and strong flavor.
Strict followers of the dietary laws of Islam and Judaism must avoid cheeses made with rennet from animals not slaughtered in a manner adhering to halal or kosher laws.[25] Both faiths allow cheese made with vegetable-based rennet or with rennet made from animals that were processed in a halal or kosher manner. Many less orthodox Jews also believe that rennet undergoes enough processing to change its nature entirely and do not consider it to ever violate kosher law (see Cheese and kashrut). As cheese is a dairy food, under kosher rules it cannot be eaten in the same meal with any meat.
Rennet derived from animal slaughter, and thus cheese made with animal-derived rennet, is not vegetarian. Most widely available vegetarian cheeses are made using rennet produced by fermentation of the fungus Mucor miehei.[26] Vegans and other dairy-avoiding vegetarians do not eat conventional cheese, but some vegetable-based cheese substitutes (soy or almond) are used as substitutes.[26]
Collecting cheese labels is called "tyrosemiophilia".[27]
Odorous cheeses
Even in cultures with long cheese traditions, consumers may perceive some cheeses that are especially pungent-smelling, or mold-bearing varieties such as Limburger or Roquefort, as unpalatable. Such cheeses are an acquired taste because they are processed using molds or microbiological cultures,[28] allowing odor and flavor molecules to resemble those in rotten foods. One author stated: "An aversion to the odor of decay has the obvious biological value of steering us away from possible food poisoning, so it is no wonder that an animal food that gives off whiffs of shoes and soil and the stable takes some getting used to".[7]
Effect on sleep
There is some support from studies that dairy products can help with insomnia.[29]
Scientists have debated how cheese might affect sleep. An antithetical folk belief that cheese eaten close to bedtime can cause nightmares may have arisen from the Charles Dickens novella A Christmas Carol, in which Ebenezer Scrooge attributes his visions of Jacob Marley to the cheese he ate.[30] This belief can also be found in folklore that predates this story.[31] The theory has been disproven multiple times, although night cheese may cause vivid dreams or otherwise disrupt sleep due to its high saturated fat content, according to studies by the British Cheese Board. Other studies indicate it may actually make people dream less.[30][32]
Figurative expressions
In the 19th century, "cheese" was used as a figurative way of saying "the proper thing"; this usage comes from Urdu cheez "a thing", from Persian cheez, from Old Persian...ciš-ciy [which means] "something". The term "cheese" in this sense was "[p]icked up by [colonial] British in India by 1818 and [was also] used in the sense of "a big thing", for example in the expression "he's the real cheez".[33] The expression "big cheese" was attested in use in 1914 to mean an "important person"; this is likely "American English in origin". The expression "to cut a big cheese" was used to mean "to look important"; this figurative expression referred to the huge wheels of cheese displayed by cheese retailers as a publicity stunt.[33] The phrase "cut the cheese" also became an American slang term meaning to flatulate. The word "cheese" has also had the meaning of "an ignorant, stupid person".[33]
Other figurative meanings involve the word "cheese" used as a verb. To "cheese" is recorded as meaning to "stop (what one is doing), run off", in 1812 (this was "thieves' slang").[33] To be "cheesed off" means to be annoyed.[33] The expression "say 'cheese'" in a photograph-taking context (when the photographer wants the people to smile for the photo), which means "smile", dates from 1930 (the word was probably chosen because the "ee" encourages people to make a smile).[33] The verb "cheese" was used as slang for "be quiet" in the early 19th century in Britain.[33] The fictional "...notion that the moon is made of green cheese as a type of a ridiculous assertion is from 1520s".[33] The figurative expression "to make cheeses" is an 1830s phrase referring to schoolgirls who amuse themselves by "...wheeling rapidly so one's petticoats blew out in a circle then dropping down so they came to rest inflated and resembling a wheel of cheese".[33] In video game slang "to cheese it" means to win a game by using a strategy that requires minimal skill and knowledge or that exploits a glitch or flaw in game design.[34]
The adjective "cheesy" has two meanings. The first is literal, and means "cheese-like"; this definition is attested to from the late 14th century (e.g., "a cheesy substance oozed from the broken jar").[33] In the late 19th century, medical writers used the term "cheesy" in a more literal sense, "to describe morbid substances found in tumors, decaying flesh, etc."[33] The adjective also has a figurative sense, meaning "cheap, inferior"; this use "... is attested from 1896, perhaps originally U.S. student slang". In the late 19th century in British slang, "cheesy" meant "fine, showy"; this use is attested to in the 1850s. In writing lyrics for pop music, rock music or musical theatre, "cheesy" is a pejorative term which means "blatantly artificial" (OED).
See also
- Dutch cheese markets
- List of cheese dishes
- List of cheeses
- List of dairy products
- List of microorganisms used in food and beverage preparation
- Sheep milk cheese
References
- ↑ 1.0 1.1 "Chymosin". GMO Compass. Archived from the original on March 26, 2015. Retrieved March 3, 2011.
- ↑ 2.0 2.1 2.2 Patrick F. Fox (2000). Fundamentals of cheese science. Springer. p. 388. ISBN 978-0-8342-1260-2. Archived from the original on November 7, 2020. Retrieved September 12, 2020.
- ↑ Patrick F. Fox (1999). Cheese: chemistry, physics and microbiology, Volume 1. Springer. p. 1. ISBN 978-0-8342-1338-8. Archived from the original on June 10, 2021. Retrieved March 23, 2011.
- ↑ "Classification of cheese types using calcium and pH". www.dairyscience.info. Archived from the original on July 23, 2011. Retrieved March 23, 2011.
- ↑ Barbara Ensrud (1981). The Pocket Guide to Cheese, Lansdowne Press/Quarto Marketing Ltd., ISBN 0-7018-1483-7
- ↑ "Classification of Cheese". www.egr.msu.edu. Archived from the original on November 24, 2011. Retrieved March 23, 2011.
- ↑ 7.0 7.1 7.2 7.3 McGee, Harold (2004). On Food and Cooking: The Science and Lore of the Kitchen. Scribner. ISBN 978-0-684-80001-1. Archived from the original on October 28, 2021. Retrieved September 12, 2020.
- ↑ Xanthe, Clay (November 18, 2006). "Finishing in style". The Telegraph. Archived from the original on October 11, 2018. Retrieved October 11, 2018.
- ↑ 9.0 9.1 9.2 "How to eat: cheese and biscuits". The Guardian. June 27, 2012. Archived from the original on June 9, 2016. Retrieved January 3, 2017.
- ↑ Clara Olshansky (March 16, 2018). "Wisconsin Cheesemakers Just Created the World's Longest Cheeseboard". Food and Wine. Archived from the original on May 25, 2018. Retrieved May 25, 2018.
- ↑ "2011 Assembly Joint Resolution 89: commending Ralph Bruno, the creator of the cheesehead hat". Wisconsin State Legislature. January 19, 2012. Archived from the original on May 26, 2018. Retrieved May 25, 2018.
- ↑ 12.0 12.1 12.2 "Nutrition facts for various cheeses per 100 g". Nutritiondata.com. Conde Nast; republished from the USDA National Nutrient Database, version SR-21. 2014. Archived from the original on June 4, 2016. Retrieved June 1, 2016.
- ↑ 13.0 13.1 Sacks, Frank M.; Lichtenstein, Alice H.; Wu, Jason H.Y.; Appel, Lawrence J.; Creager, Mark A.; Kris-Etherton, Penny M.; Miller, Michael; Rimm, Eric B.; Rudel, Lawrence L.; Robinson, Jennifer G.; Stone, Neil J.; Van Horn, Linda V. (June 15, 2017). "Dietary Fats and Cardiovascular Disease: A Presidential Advisory From the American Heart Association". Circulation. 136 (3): e1–e23. doi:10.1161/CIR.0000000000000510. PMID 28620111. S2CID 367602.
- ↑ "Food Fact Sheet - Cholesterol" (PDF). Association of UK Dietitians. December 1, 2018. Archived (PDF) from the original on February 1, 2012. Retrieved July 28, 2019.
- ↑ "Eat less saturated fat". National Health Service. June 1, 2017. Archived from the original on April 24, 2015. Retrieved July 28, 2019.
- ↑ "Heart-healthy diet: 8 steps to prevent heart disease". Mayo Clinic. January 9, 2019. Archived from the original on July 27, 2019. Retrieved July 28, 2019.
- ↑ FDA Warns About Soft Cheese Health Risk" Archived January 22, 2013, at the Wayback Machine. Consumer Affairs. Retrieved October 15, 2005.
- ↑ Chris Mercer (September 23, 2005). "Australia lifts Roquefort cheese safety ban". ap-foodtechnology.com. Archived from the original on June 27, 2006. Retrieved October 22, 2005.
- ↑ Listeria and Pregnancy. Archived February 24, 2006, at the Wayback Machine. Retrieved February 28, 2006.
- ↑ Neupaney, D.; Kim, J.; Ishioroshi, M.; Samejima, K. (1997). "Study on Composition of Nepalese Cheeses, Yak Milk and Yak Cheese Whey". Milk Science. 46 (2). Archived from the original on August 25, 2017. Retrieved June 2, 2017.
- ↑ Nair, Anooja; Choden, Dechen; Pradhan, Monika (April 21, 2022). "Chemical composition and microbial quality of Datshi and Zoety , unripen cottage cheese of Bhutan". Food Science & Nutrition. 10 (5): 1385–1390. doi:10.1002/fsn3.2715. ISSN 2048-7177. PMC 9094472 Check
|pmc=value (help). PMID 35592292 Check|pmid=value (help). - ↑ "How to Make Ema Datshi-the National Dish of Bhutan". Inspiria Knowledge Campus. February 26, 2015. Archived from the original on August 25, 2017. Retrieved June 2, 2017.
- ↑ Allen, Barry; Allen, Silvia. "Mozzarella of the East (Cheese-making and Bai culture)" (PDF). Ethnorêma. Archived (PDF) from the original on December 2, 2017. Retrieved June 2, 2017.
- ↑ Buckman, Rebecca (2003). "Let Them Eat Cheese". Far Eastern Economic Review. 166 (49): 41. Archived from the original on September 23, 2005. Retrieved September 25, 2005.
- ↑ "Frequently Asked Questions about Halal Foods". Toronto Public Health. Archived from the original on November 24, 2005. Retrieved October 15, 2005.
- ↑ 26.0 26.1 Mauseth, James D (2012). Plants and People. Jones & Bartlett Publishers. p. 432. ISBN 978-0-7637-8550-5. Archived from the original on October 28, 2021. Retrieved October 8, 2020.
- ↑ "Cheese label". Virtualroom.de. Archived from the original on April 4, 2009. Retrieved May 1, 2010.
- ↑ Hui YH, Meunier-Goddik L, Josephsen J, Nip WK, Stanfield PS (2004). Handbook of Food and Beverage Fermentation Technology: Food Science and Technology (Marcel Dekker), Vol 134. CRC Press. pp. 392–93. ISBN 978-0-8247-5122-7. Archived from the original on October 28, 2021. Retrieved October 8, 2020.
- ↑ Komada, Yoko; Okajima, Isa; Kuwata, Tamotsu (2020). "The Effects of Milk and Dairy Products on Sleep: A Systematic Review". International Journal of Environmental Research and Public Health. 17 (24): 9440. doi:10.3390/ijerph17249440. PMC 7766425. PMID 33339284.
- ↑ 30.0 30.1 Extance, Andy (December 16–19, 2015). "Brie encounter". New Scientist. 228 (3052–3053): 69–70. Bibcode:2015NewSc.228...69E. doi:10.1016/S0262-4079(15)31866-2.
- ↑ Oates, Caroline (2003). "Cheese gives you nightmares: Old hags and heartburn". Folklore (London). 114 (2): 205–225. doi:10.1080/0015587032000104220. S2CID 161962480.
- ↑ Mosley, Dr. Michael (2020). Fast Asleep: Improve Brain Function, Lose Weight, Boost Your Mood, Reduce Stress, and Become a Better Sleeper. Atria Books. ISBN 978-1982106928.
- ↑ 33.00 33.01 33.02 33.03 33.04 33.05 33.06 33.07 33.08 33.09 33.10 Cite error: Invalid
<ref>tag; no text was provided for refs namedonline - ↑ dictionary.com. "Article to Cheesed". dictionary.com. Archived from the original on July 8, 2017. Retrieved July 28, 2017.
Bibliography
- Ensrud, Barbara (1981). The Pocket Guide to Cheese. Sydney: Lansdowne Press. ISBN 978-0-7018-1483-0.
- Jenkins, Steven (1996). Cheese Primer. Workman Publishing Company. ISBN 978-0-89480-762-6.
- Mellgren, James (2003). "2003 Specialty Cheese Manual, Part II: Knowing the Family of Cheese". Archived from the original on June 24, 2003. Retrieved October 12, 2005.
Further reading
- Layton, T.A. (1967) The ... Guide to Cheese and Cheese Cookery. London: Wine and Food Society (reissued by the Cookery Book Club, 1971)
- Buckingham, Cheyenne (May 1, 2019). "Is It Bad to Eat Cheese With Mold On It?". Eat This, Not That!.
External links
- Template:Gutenberg
- Cheese.com – includes an extensive database of different types of cheese.
- Classification of cheese – why is one cheese type different from another?
| Types | |
|---|---|
| Animal milk | |
| Regions | |
| Special designations | |
| Organizations | |
| List articles | |
| Miscellaneous | |
| Source |  | |
|---|---|---|
| Types | ||
| Products | ||
| Containers | ||
| Topics | ||
Lua error in Module:Authority_control at line 239: attempt to call field '_showMessage' (a nil value).