File:Total CO2 by Region.svg
Jump to navigation
Jump to search

Size of this PNG preview of this SVG file: 800 × 450 pixels. Other resolutions: 320 × 180 pixels | 640 × 360 pixels | 1,024 × 576 pixels | 1,280 × 720 pixels | 2,560 × 1,440 pixels | 1,200 × 675 pixels.
Original file (SVG file, nominally 1,200 × 675 pixels, file size: 7 KB)
Summary
| Description |
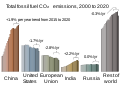
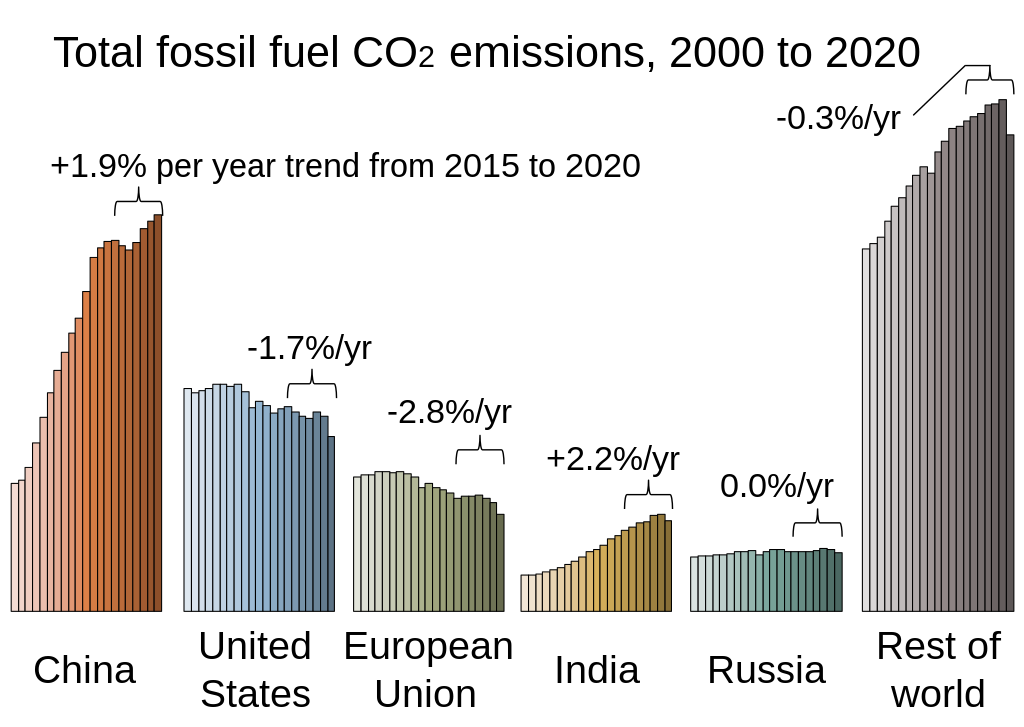
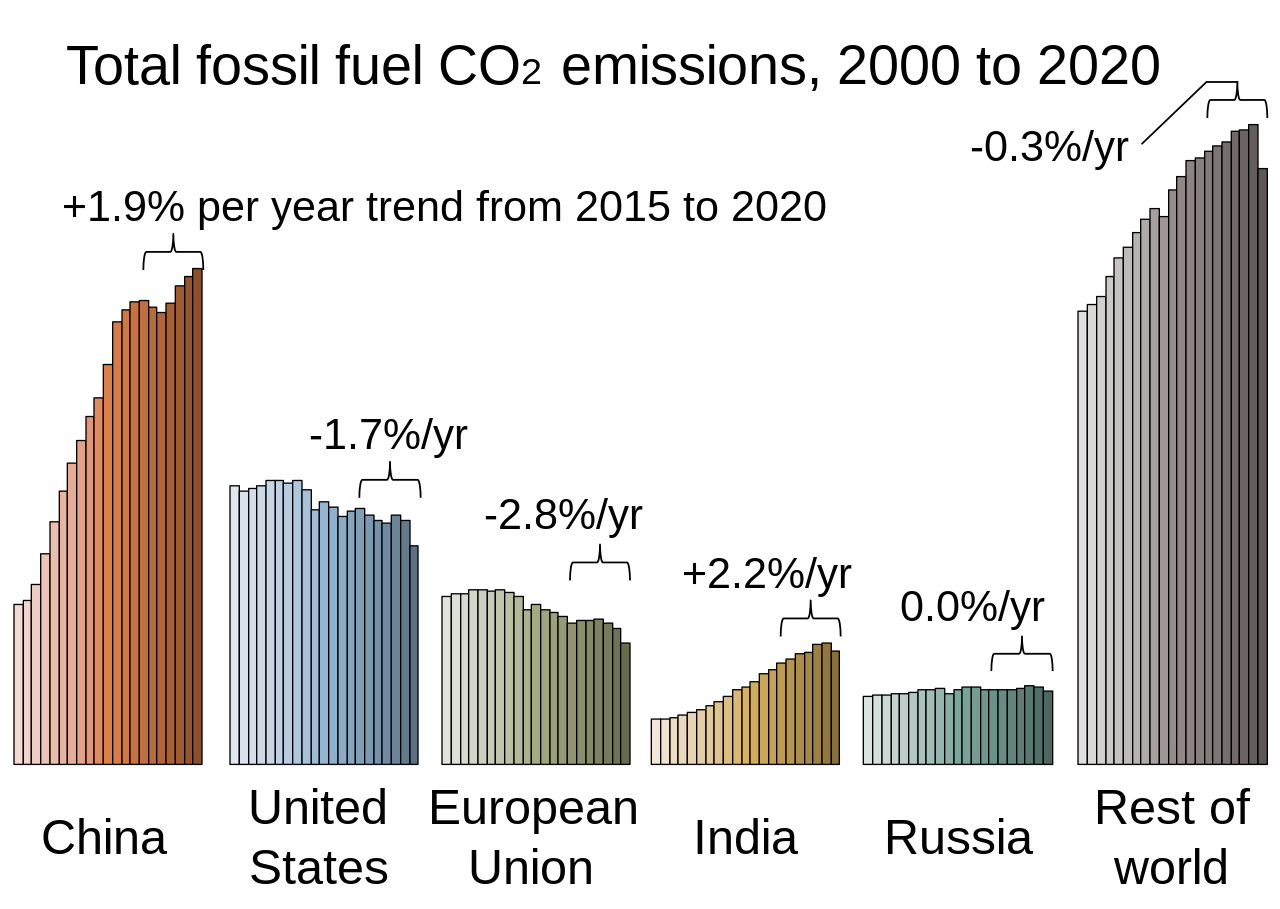
English: Chart showing carbon dioxide emissions by region over time.
العربية: رسمٌ بياني يُوضّح انبعاثات غاز ثاني أكسيد الكربون من حرقِ الوقود الأحفوري في عددٍ من الدول وذلك من عام 2000 حتى عام 2020. |
||
| Date | |||
| Source | Own work | ||
| Author | Efbrazil for Version 1, and User:RCraig09 for Version 13 | ||
| Other versions |
|
.svg)
Related files
Charts based on data from the same source, and having similar graphic design approach (multiple bar charts):
-
 Total CO2 by Region.svg
 -
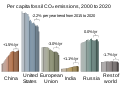 Per Capita CO2 by Region.svg
 -
 Global Energy Consumption.svg


Licensing
I, the copyright holder of this work, hereby publish it under the following license:
This file is licensed under the Creative Commons Attribution-Share Alike 4.0 International license.
- You are free:
- to share – to copy, distribute and transmit the work
- to remix – to adapt the work
- Under the following conditions:
- attribution – You must give appropriate credit, provide a link to the license, and indicate if changes were made. You may do so in any reasonable manner, but not in any way that suggests the licensor endorses you or your use.
- share alike – If you remix, transform, or build upon the material, you must distribute your contributions under the same or compatible license as the original.
File history
Click on a date/time to view the file as it appeared at that time.
| Date/Time | Thumbnail | Dimensions | User | Comment | |
|---|---|---|---|---|---|
| current | 03:13, 20 March 2026 | | 1,200 × 675 (7 KB) | wikimediacommons>RCraig09 | Version 13: update to include data through 2025 . . . . . made SVG code more efficient (7 KB) . . . removed extraneous text re growth rates for 5 years . . . kept basic design and color scheme the same |
File usage
The following 10 pages use this file:
- Greenhouse gas emissions by the United States
- Greenhouse gas emissions by the United States/en
- Greenhouse gas emissions by the United States/ja
- Paris Agreement
- Paris Agreement/en
- Paris Agreement/ja
- Translations:Greenhouse gas emissions by the United States/19/en
- Translations:Greenhouse gas emissions by the United States/19/ja
- Translations:Paris Agreement/58/en
- Translations:Paris Agreement/58/ja